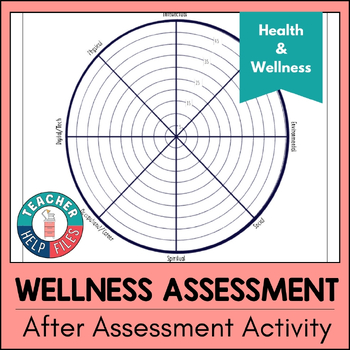
This is a spider chart (also known as a radar chart or web chart) used to visually display data across multiple categories to identify strengths, weaknesses, and patterns at a glance. It is particularly useful for:
1. Visualizing Multidimensional Data.
2. Identifying Strengths and Weaknesses
3. Comparing Results
4. Encouraging Self-Reflection
5. Setting Goals and Prioritizing Areas
Spider charts are especially effective for secondary students because they are easy to interpret and provide a visual, interactive way to engage with their assessment results.
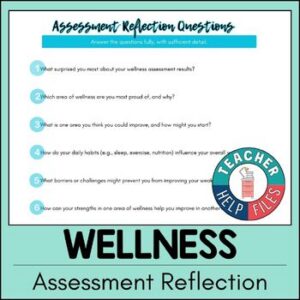
This is to be paired with my Wellness Assessment.